Visual Analytics
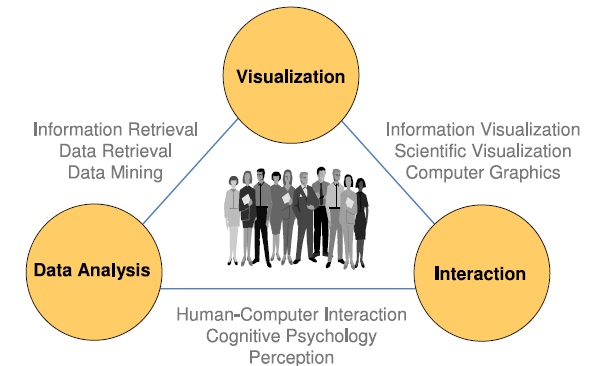
Dec 16th, 2009 | By VisMaster Team | Category: NewsVisual analytics is the science of analytical reasoning supported by interactive visual interfaces according to. Over the last decades data was produced at an incredible rate. However, the ability to collect and store this data is increasing at a faster rate than the ability to analyze it. While purely automatic or purely visual analysis methods were developed in the last decades, the complex nature of many problems makes it indispensable to include humans at an early stage in the data analysis process.

Visual analytics methods allow decision makers to combine their exibility, creativity, and background knowledge with the enormous storage and processing capacities of today’s computers to gain insight into complex problems. The goal of visual analytics research is thus to turn the information overload into an opportunity by enabling decision-makers to examine this massive information stream to take effective actions in real-time situations.
Read the full article here:
Daniel A. Keim, Florian Mansmann, Andreas Stoffel, Hartmut Ziegler: Visual Analytics, Encyclopedia of Database Systems, Springer, December, 2009.