RoadVis Demonstrator
Apr 12th, 2010 | By VisMaster Team | Category: Featured Articles, Interactive Demos, News The large and ever-increasing amounts of time-varying and geospatial digital weather information related to emergency scenarios that must be accessible to the public represent a major research challenge. A need to analyze and make decisions, often in time-critical situations, demand interactive web-enabled visualization tools that can aid the user to explore, communicate and publish visually large geo-information spaces.
Geovisual analytics is an emerging research task facilitating dynamic time-linked visual representations that enable the users to simultaneously analyse relations among several different attributes with the aim to augment an analyst and decision-maker capabilities to assimilate complex situations and reach important knowledge.
In this context, we introduce a web-enabled application for road weather visualization, a tool for analyzing and communicating information about road weather conditions particularly during the Swedish winter months.
RoadVis is customized in close collaboration with domain experts from Swedish Meteorological and Hydrological Institute (SMHI) and the Swedish road administration facilitating a collection of dynamic map, weather and information visualization methods integrated with the Adobe© Flash© and Flex© development platform.
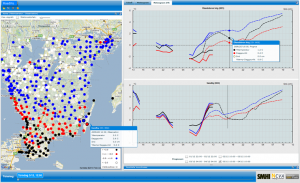
 RoadVis multi-linked visual user interface, where a station, represented by a circle, is here coloured according to temperature. Meteorological diagrams are shown for two selected stations in the map. A parallel coordinates plot makes dynamic inquires and filter the multivariate weather data. A time slider controls time steps for the time-linked views.
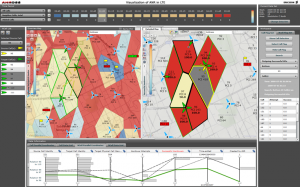
Further: This applied research project is cooperation between NCVA and Ericsson Research facilitating a strong synergy between world-leading visualization technology and management of mobile communication networks.
The project targets Visual Analytics, where novel techniques are being developed and applied to smart network management prototypes for mobile communication networks. Research focuses on network management applications for mobile communication networks in 3GPP defined systems, such as Long Term Evolution (LTE).
Additionally, the project targets operator-promoted Self-Organizing Networks (SON) features, which manage the complexity in large networks. The overall objective of the project is to prototype smarter network management applications for mobile communication networks. The system shall assist the operators in a smart way. The input to the system is a voluminous real-time flow of spatial-temporal and multivariate information with an objective to high-light the important problems to the operator, utilizing advanced visualization and data-mining techniques.
Thus, the information is interpreted and transferred to the operator in a suitable way, which improves the comprehensibility and reliability. Particularly, it is important to provide operators with a system that ensure trust in automatic SON features in the mobile communication network, which are means to cope with the high complexity of today’s networks.
The system shall be scalable from smaller networks up to networks with thousands of nodes. To the operator, the application shall be perceived as one integrated solution, although the network may comprise a multitude of radio-access-technologies (multi-RAT), like GSM, WCDMA and LTE, standardized by 3GPP. As a world leading supplier of communications networks, Ericsson is ramping up its efforts in the area of Visual Analytics with special focus on SON features in LTE.
Last year feasibility study show overwhelming reactions from operators and a first prototype has been used in academic and commercial presentations, panel boards and customer face to face meetings. A joined scientific research paper was presented at the IEEE VAST 2009 conference in the US.