Tools about the new London Bike Hire scheme
Sep 8th, 2010 | By Dr. Jason Dykes | Category: Interactive Demos, NewsBikeGrid reveals geographic patterns in London bike hire usage
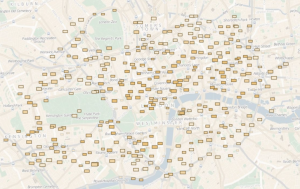
A new interactive application written by the giCentre uses live data from the Barclays Cycle Hire scheme to reveal patterns in docking station use across London. BikeGrid uses spatial treemaps to show the last 24 hours use of all London docking stations in a grid.
To use the BikeGrid application, find out where bikes and spaces are available across London and explore spatio-temporal patterns in recent cycle usage, go to gicentre.org/bikegrid.
Bike Availability in London over the last 24 hours
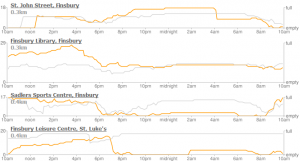
Bike Graphs use open map and graphic APIs to visualize the status of the new London bike hire scheme. The graphs show the availability of bikes over the last 24 hours for over 300 docking stations and allow comparision with usage 1 or 7 days
previously. Docking stations can be sorted by distance from the station of your choice enabling patterns of use to be explored through time: for example, discover which times of day docking stations are popular destinations or where and when it is difficult to find a bike to hire.

