Geovisual Analytics applied to Weather and Ship Data
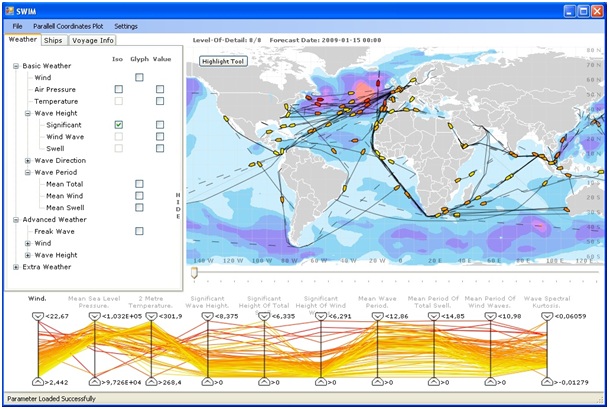
Dec 14th, 2009 | By VisMaster Team | Category: NewsThe shipping industry has a need to draw accurate conclusions and make well planned decisions regarding routes and weather factors. There are a large number of variables affecting the success of every sea voyage performed by vessels such as cargo ships. Important aspects being considered are speed, safety and costs because of their direct impact on the voyage performance. Weather factors are the main concern when considering these aspects and therefore shipping companies consult meteorologists about weather information and route optimization. Ship and Weather Information Monitoring (SWIM) was created to aid shipping companies monitoring vessels according to forecasted weather development along planned routes. SWIM provides support for decisions regarding route choice with respect to future weather development and warnings of extreme weather factors. With weather forecasts and voyage information provided by the European Centre for Medium- Range Weather Forecasts (ECMWF) and SMHI shipping companies can monitor fleets using highly interactive visual representations visualizing weather parameters and detailed voyage information. Using geographical visualization together with a parallel coordinates plot brings great possibilities when exploring the data. SWIM was designed with the following tasks in mind:
• Detailed monitoring of voyages based on planned and reported waypoints.
• Easy exploration of weather forecast according to both geographic positions and along routes.
• Using a PCP together with geographic map visualization to find interesting voyages according to weather parameters.
• Using highly interactive linked visual representations to facilitate exploration of data
http://ncva.itn.liu.se/content/1/c6/14/52/52/IV09_ship.wmv

Lundblad P, Eurenius O, Heldring T, ”Interactive Visualization of Weather and Ship Data,” reviewed proceedings in IEEE Information Visualization Conference IV09, Barcelona 2009.