The Visual Analytics Process

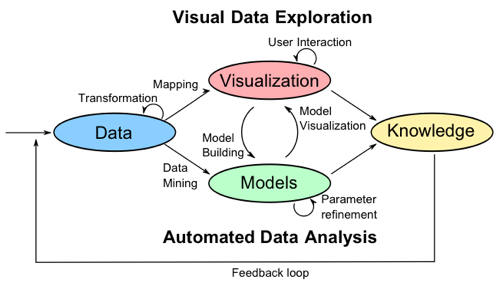
The Visual Analytics Process combines automatic and visual analysis methods with a tight coupling through human interaction in order to gain knowledge from data. The figure shows an abstract overview of the different stages (represented through ovals) and their transitions (arrows) in the Visual Analytics Process.
In many application scenarios, heterogeneous data sources need to be integrated before visual or automatic analysis methods can be applied. Therefore, the first step is often to preprocess and transform the data to derive different representations for further exploration (as indicated by the Transformation arrow in the figure). Other typical preprocessing tasks include data cleaning, normalization, grouping, or integration of heterogeneous data sources.
After the transformation, the analyst may choose between applying visual or automatic analysis methods. If an automated analysis is used first, data mining methods are applied to generate models of the original data. Once a model is created the analyst has to evaluate and refine the models, which can best be done by interacting with the data. Visualizations allow the analysts to interact with the automatic methods by modifying parameters or selecting other analysis algorithms. Model visualization can then be used to evaluate the findings of the generated models. Alternating between visual and automatic methods is characteristic for the Visual Analytics process and leads to a continuous refinement and verification of preliminary results. Misleading results in an intermediate step can thus be discovered at an early stage, leading to better results and a higher confidence. If a visual data exploration is performed first, the user has to confirm the generated hypotheses by an automated analysis. User interaction with the visualization is needed to reveal insightful information, for instance by zooming in on different data areas or by considering different visual views on the data. Findings in the visualizations can be used to steer model building in the automatic analysis. In summary, in the Visual Analytics Process knowledge can be gained from visualization, automatic analysis, as well as the preceding interactions between visualizations, models, and the human analysts.